Root Cause Analysis (RCA) - A Practical Guide for Developers & Teams
Introduction — What is RCA?
Root Cause Analysis is a systematic process used to identify the underlying causes of a problem rather than just fixing it’s symptoms. In software development, RCA is what that turns a production issue into a lesson that strengthens your systems.
If a bug slipped into production or a system outage occurred — RCA ensures you never face that same issue again.
Why RCA Matters?
- Prevention over reaction: RCA focuses on long-term fixes, not temporary patches.
- Improved reliability: Each RCA makes systems more stable and predictable.
- Knowledge sharing: Documented RCA reports build organisational learning.
- Accountability without blame: Focuses on what failed, not who.
RCA Is one of the pillars of Site Reliability Engineering (SRE) and DevOps maturity.
Diagram - RCA Process Overview:
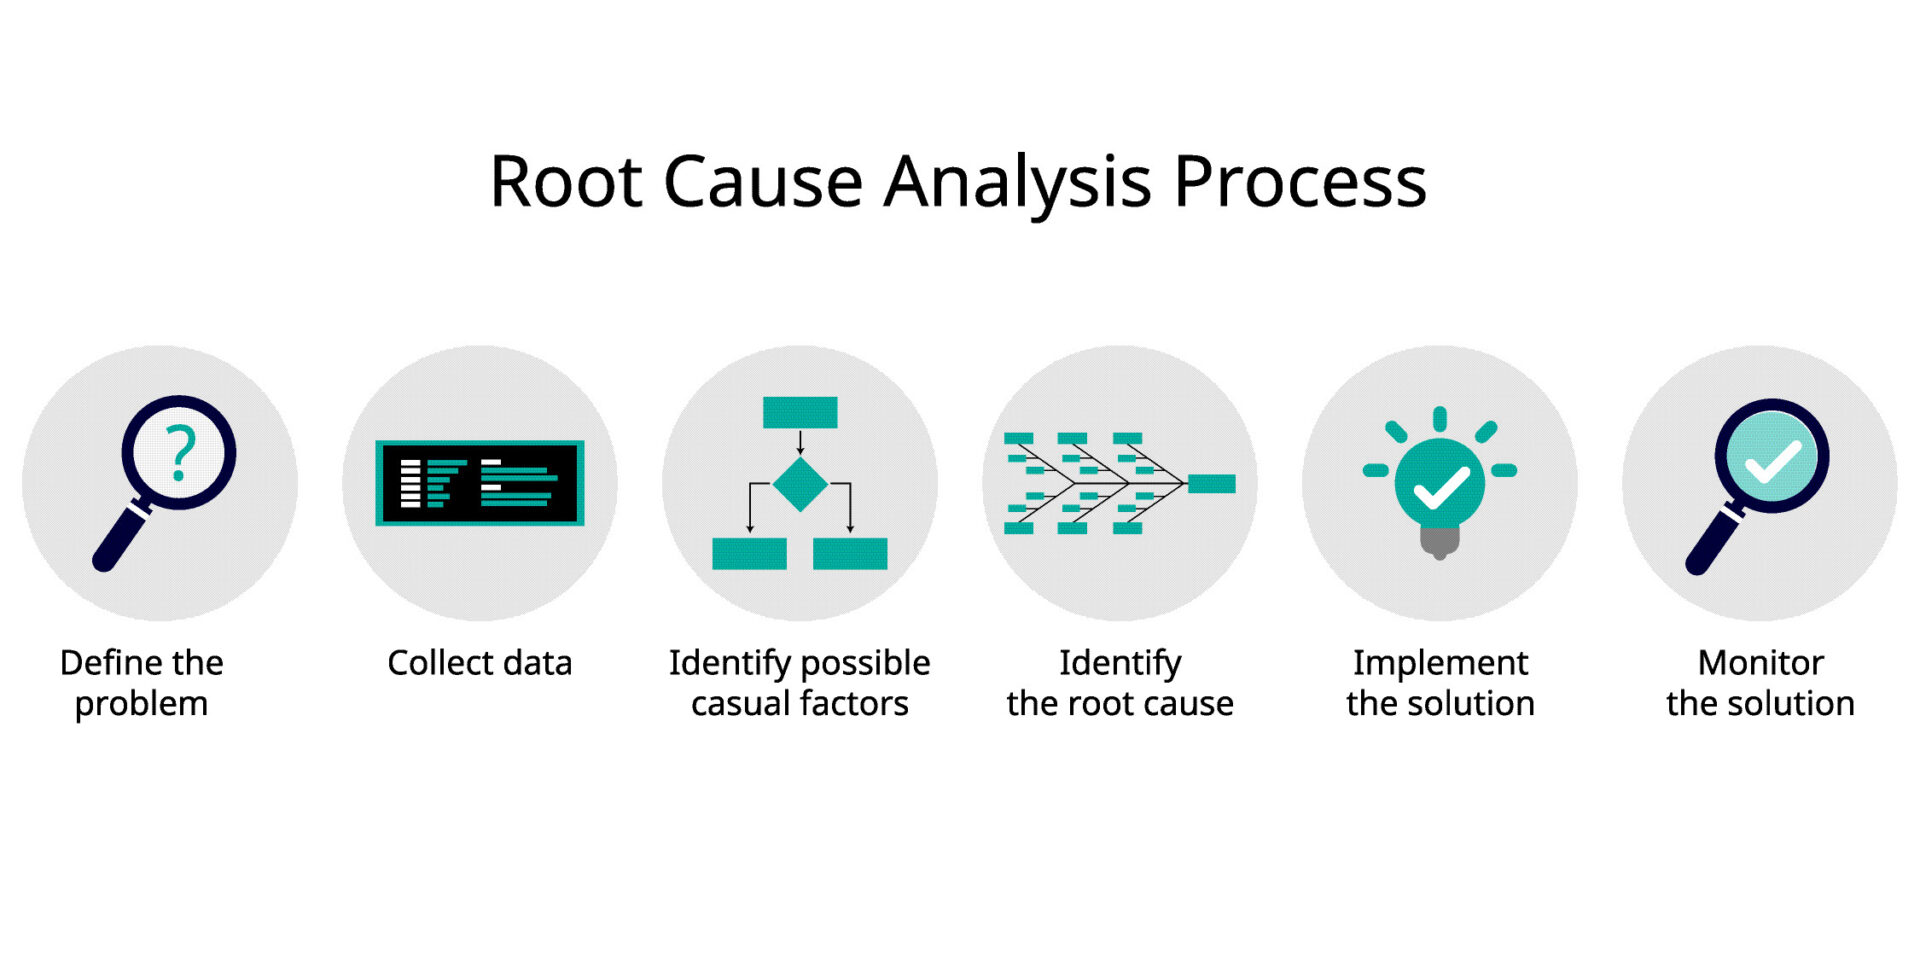
Figure: The Root Cause Analysis Process — From problem identification to continuous improvement
(Source: Root Cause Analysis: Unlocking Efficiency and Quality with Autodesk Solutions - By Shannon McGarry)
How RCA Started?
The concept originated in engineering and manufacturing particularly in the Toyota Production System during the 1950s.
Toyota introduced structured problem-solving methods like the “5 Whys” and Fishbone Diagrams, later adopted in IT, healthcare, and aviation — and now heavily used in post-incident reviews in software engineering.
RCA in Modern Software Teams:
In tech, RCA is typically performed after:
- Production outages (downtime, degraded performance)
- Security breaches
- Data inconsistencies
- Build/deployment pipeline failures
It’s commonly part of Post-Incident Reviews (PIRs) or Post-Mortems conducted by SREs, Developers, and QA teams.
The RCA Process — Step-by-Step:
| Step | Description |
|---|---|
| 1. Define the Problem | Describe what happened, when, and who noticed. Keep it factual. |
| 2. Collect Data | Logs, metrics, alerts, commit history, screenshots — anything relevant. |
| 3. Identify Contributing Factors | Look for triggers or conditions that made the incident worse. |
| 4. Find the Root Cause(s) | Apply analytical methods like 5 Whys or Fishbone Diagrams. |
| 5. Implement Corrective Actions | Define fixes to prevent recurrence (code, config, process). |
| 6. Validate the Fix | Ensure the issue doesn’t resurface under the same conditions. |
| 7. Document & Share Learnings | Create a standardised RCA report for team visibility. |
RCA Document Format (Template):
A standard RCA document should be simple yet complete.
Here’s a widely used developer-friendly RCA format:
📄 Root Cause Analysis Report

1. Incident Title:
2. Date & Duration:
3. Impact Summary:
   - Services affected
   - User impact (count, region)
4. Timeline:
   - 10:30 AM — Issue detected
   - 10:45 AM — Investigation started
   - 11:15 AM — Fix deployed
5. Root Cause:
   - [Explain the exact reason — config error, null pointer, DB lock, etc.]
6. Contributing Factors:
   - [E.g., insufficient alerting, missing retry logic, etc.]
7. Corrective Actions:
   - Short-term: Rollback service
   - Long-term: Add validation + new monitoring rule
8. Prevention Measures:
   - [Code review checklist update, CI/CD gate, etc.]
9. Owner & Follow-up Date:
The 5 Whys Technique:
What is it?
The 5 Whys is a simple yet powerful Root Cause Analysis technique developed by Sakichi Toyoda, the founder of Toyota Industries.
It’s designed to uncover the underlying cause of a problem by repeatedly asking “Why?” — typically five times — until the true root cause emerges.
It’s not about assigning blame but about revealing process flaws, gaps, or systemic weaknesses that led to the issue.
What Are the 5 Whys?
Here’s how it typically unfolds in an RCA session:
| Step | Question | Example |
|---|---|---|
| Why #1 | Why did the system fail? | Because the API crashed. |
| Why #2 | Why did the API crash? | Because it ran out of memory. |
| Why #3 | Why did it run out of memory? | Because a background process consumed too much memory. |
| Why #4 | Why did the background process consume so much memory? | Because it was loading all records at once instead of batching. |
| Why #5 | Why was batching not implemented? | Because the feature was rushed and missed during code review. |
Root Cause: Incomplete review process, not just a coding bug.
Features:
- A qualitative method — focuses on logical reasoning, not statistics.
- Works best when combined with timeline data and logs.
- Can be used by anyone — developers, QA, or management — to trace systemic issues.
- Encourages team collaboration and reflection instead of blame.
Examples:
-
Production Outage:
The database server failed because of an unhandled null pointer in a background script — traced back to missing validation in the deployment process.
-
High API Latency:
The service slowed down because of inefficient queries — traced back to lack of performance testing before release.
Advantages:
- Simple and cost-free to apply.
- Quick to conduct even during incident calls.
- Helps uncover process-level weaknesses often overlooked by pure technical analysis.
- Promotes a culture of continuous improvement.
Limitations:
- May oversimplify complex incidents that have multiple contributing causes.
- Highly dependent on the facilitator’s objectivity — bias can skew results.
- Doesn’t quantify severity or probability of causes.
- In large-scale distributed systems, five “whys” may not be enough.
The 80:20 Rule (Pareto Principle):
What Is It?
The 80:20 Rule, also known as the Pareto Principle, is a concept stating that 80% of outcomes result from 20% of causes.
Named after Italian economist Vilfredo Pareto, who observed that 80% of Italy’s wealth was owned by 20% of the population, this rule now applies across industries — from software reliability to customer support.
In RCA, it helps teams focus their energy on the few root causes that create the most recurring problems.
Features:
- A prioritisation tool, not a diagnostic one.
- Often used with RCA data to highlight which causes appear most frequently.
- Helps visualize impact through Pareto Charts (bar + line graphs).
- Useful for resource allocation in DevOps and QA teams.
Examples:
-
Software Bugs:
80% of production issues arise from 20% of the codebase (often legacy modules).
-
Performance Bottlenecks:
80% of latency may come from 20% of API endpoints.
-
User Feedback:
80% of user complaints often relate to 20% of product features.
Advantages:
- Makes RCA actionable — helps teams prioritise what to fix first.
- Prevents wasting time on low-impact issues.
- Data-driven approach ideal for continuous improvement cycles.
- Works well when used with tools like Grafana, Kibana, or Jira analytics for real-time visibility.
Limitations:
- Not a true analytical method — it identifies patterns, not causes.
- The 80:20 ratio is heuristic, not mathematically exact.
- May lead teams to overlook rare but critical edge cases.
- Requires sufficient data points for accurate interpretation.
Other RCA Models:
Beyond the 5 Whys and 80:20 Rule, several structured RCA techniques help analyze problems from different perspectives — particularly useful for complex software or infrastructure systems.
Fishbone (Ishikawa) Diagram:
What It Is:
A visual tool that resembles a fish skeleton — where the “head” represents the problem, and the “bones” categorize potential causes.
Diagram: Fishbone (Ishikawa)
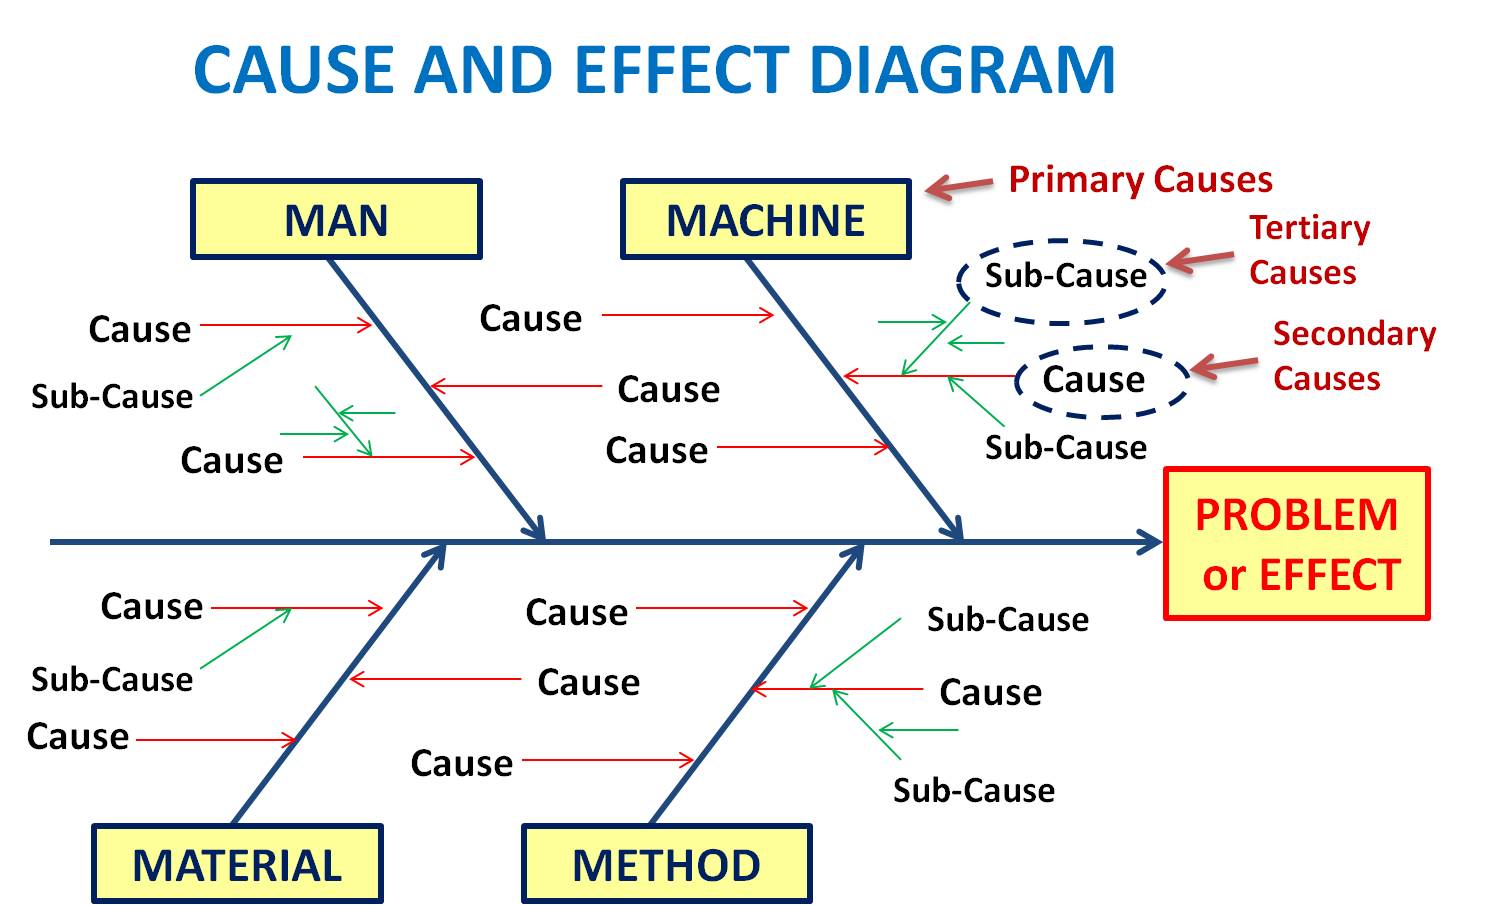
Figure: Fishbone (Ishikawa) Diagram
(Source: What is a Fishbone Diagram? Ishikawa Diagram | Cause & Effect Diagram - By TQP)
Common Categories:
- People: Human error, lack of training, communication gaps
- Process: Missing steps, poor documentation, review gaps
- Technology: Bugs, misconfigurations, outdated libraries
- Environment: System load, deployment conditions, external dependencies
When to Use:
- Collaborative sessions (e.g., blameless postmortems)
- Incidents with multiple interacting causes
Key Advantage:
Makes root causes visible and structured — encourages group brainstorming and avoids narrow thinking.
Fault Tree Analysis (FTA):
What It Is:
A top-down logic diagram showing how different faults combine to cause a system failure. It uses AND and OR gates to represent dependencies between events.
Example:
Top Event: Website Outage
- OR → Network Down
- OR → Application Crash
- AND → (Database Timeout + Cache Miss)
When to Use:
- Infrastructure or distributed system failures
- Scenarios involving cascading effects (like AWS outages)
Key Advantage:
Helps identify multiple root causes and the logical relationship between them — perfect for complex DevOps environments.
5W1H Method:
What It Is:
A structured questioning framework for gathering complete information about an incident.
It answers:
Who, What, Where, When, Why, and How.
Example:
- Who was impacted? → End-users in EU region
- What happened? → Checkout API timed out
- Where? → Payments micro-service
- When? → During Black Friday peak load
- Why? → Rate limiter misconfiguration
- How? → Default limits deployed from staging config
When to Use:
- During initial incident triage
- When data gathering precedes deeper RCA
Key Advantage:
Creates a comprehensive incident summary useful for both engineers and management.
DMAIC (Six Sigma Method):
What It Is:
A data-driven improvement cycle adopted from Six Sigma, used to refine processes systematically.
Phases:
- Define: Identify the issue or deviation.
- Measure: Gather quantitative data (metrics, error rates).
- Analyse: Examine patterns to locate root causes.
- Improve: Implement fixes or optimisations.
- Control: Monitor performance to sustain improvements.
When to Use:
- Continuous process improvement
- Long-term DevOps or CI/CD pipeline optimisation.
Key Advantage:
Transforms RCA from a one-time exercise into a sustainable improvement framework.
Advantages / Key Takeaways of Practicing RCA:
- Blameless Learning Culture: Encourages teams to analyse systems, not people.
- Reduced Recurrence: Once the root cause is fixed, similar issues decline sharply.
- Continuous Improvement: Converts every failure into process enhancement.
- Cross-Team Collaboration: Developers, QA, and Ops align on long-term fixes.
- Documentation Value: RCA reports become internal learning assets.
- Improved System Reliability: Over time, MTTR (Mean Time To Recovery) decreases while stability increases.
In short, RCA transforms firefighting teams into learning organizations.
Closing Note:
Root Cause Analysis isn’t just a post-incident checklist — it’s a mindset shift.
It teaches teams to look beyond symptoms, trace systemic weaknesses, and drive continuous improvement.
Whether you’re debugging a failing API, resolving a production outage, or optimising your CI/CD workflow — RCA ensures that every issue becomes an opportunity to build stronger, smarter systems.
Great teams fix issues. Exceptional teams learn.
References/Further Reading:
What is a root cause analysis? - By IBM (🔗 Link)
What Is Root Cause Analysis? The Complete RCA Guide (🔗 Link)
Root Cause Analysis: Unlocking Efficiency and Quality with Autodesk Solutions (🔗 Link)
What is a Fishbone Diagram? Ishikawa Diagram | Cause & Effect Diagram (🔗 Link)
Enjoyed this post?
Stay in the loop
New posts + weekly digest, straight to your inbox.
Create a free account
- Save posts to your vault
- Like posts & build history
- New-post alerts
Comments
Add Your Comment
Related Posts
Production Engineering: Incident Fatigue — Why Teams Stop Learning from Outages
0 104
Production Engineering: What Incident Timelines Don’t Show
0 111
Production Engineering: Technical Debt — When to Fix, When to Ignore
0 239
7-Day AI Crash Course
Learn how AI works, explore real-world examples, and build your first smart models step-by-step.
Perfect for beginners, students, and tech enthusiasts ready to start their AI journey.
No comments yet. Be the first to comment!