🧠 AI with Python - 📊 Plot Feature Importance from Decision Tree.
Posted on: August 7, 2025
Description:
Introduction
One of the best things about Decision Trees is how interpretable they are compared to many other ML models.
Not only can we visualize the tree structure itself, but we can also understand which features influenced the predictions the most.
This concept is called Feature Importance.
In this blog, we’ll explore:
- What feature importance means
- How to extract it from a trained decision tree
- How to visualize it for better interpretation
What is Feature Importance?
Feature importance scores tell us how useful or valuable each feature is when building the model.
For Decision Trees, it is calculated based on how much each feature reduces impurity (like Gini or Entropy) across all the splits where it is used.
A higher score means that feature has contributed more to the model’s predictive power.
Dataset & Model Training
We use the classic Iris dataset and train a Decision Tree classifier:
from sklearn.datasets import load_iris
from sklearn.tree import DecisionTreeClassifier

iris = load_iris()
X, y = iris.data, iris.target

model = DecisionTreeClassifier(random_state=42)
model.fit(X, y)
Extracting Feature Importance
After training, scikit-learn provides the feature importance values directly:
importance = model.feature_importances_
We combine these into a pandas DataFrame for easy sorting:
import pandas as pd

df_importance = pd.DataFrame({
    'Feature': iris.feature_names,
    'Importance': importance
}).sort_values(by='Importance', ascending=False)

df_importance
This gives a table ranking each feature based on its contribution to the model.
Visualizing Feature Importance
To better understand feature contributions, we plot them as a bar chart:
import matplotlib.pyplot as plt

plt.figure(figsize=(8, 5))
plt.barh(df_importance['Feature'], df_importance['Importance'], color='teal')
plt.xlabel('Importance Score')
plt.ylabel('Feature')
plt.title('Feature Importance from Decision Tree')
plt.gca().invert_yaxis()
plt.show()
Example Output
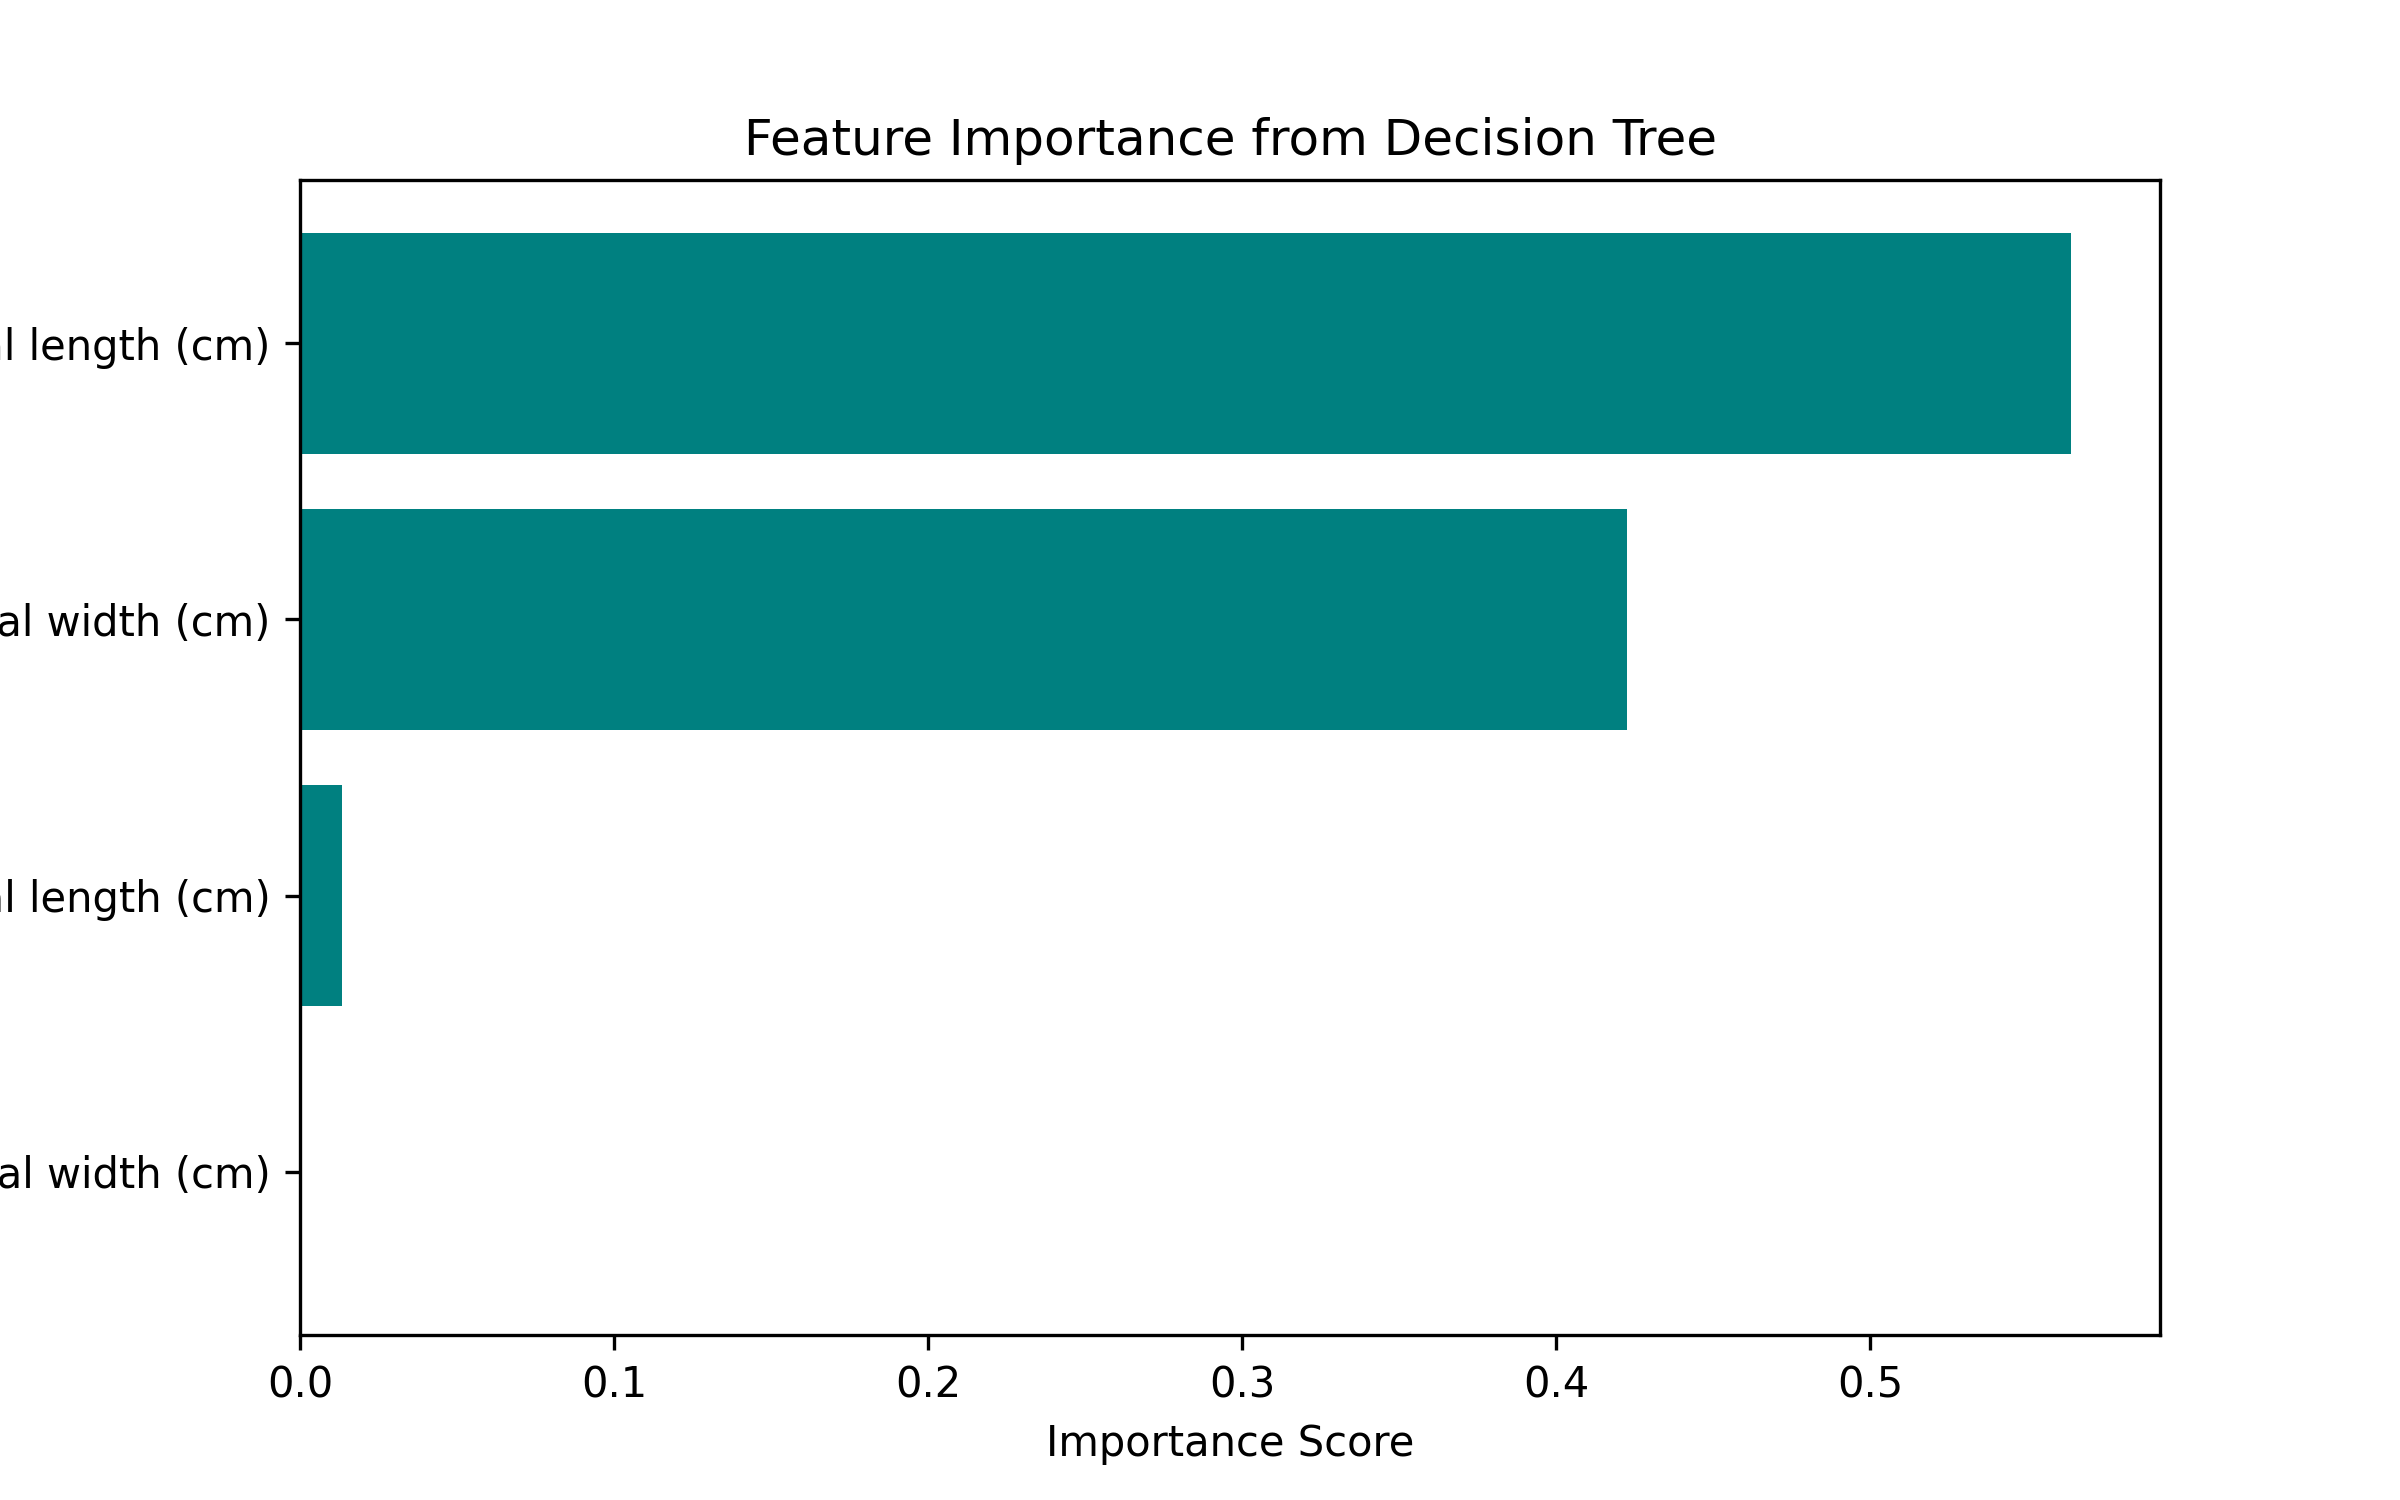
Figure: Feature Importance Plot
Why is Feature Importance Useful?
- Helps understand model behavior
- Useful for feature selection (drop features that contribute very little)
- Enhances explainability for non-technical stakeholders
Key Takeaways
- Decision Trees can rank features based on their influence on predictions.
- clf.feature_importances_ gives a numerical score for each feature.
- A simple bar chart makes interpretation quick and intuitive.
Code Snippet:
# Import required libraries
import matplotlib.pyplot as plt
from sklearn.datasets import load_iris
from sklearn.tree import DecisionTreeClassifier
import pandas as pd


# Load dataset
iris = load_iris()
X, y = iris.data, iris.target
feature_names = iris.feature_names

# Train Decision Tree
model = DecisionTreeClassifier(random_state=42)
model.fit(X, y)


# Extract feature importance
importance = model.feature_importances_
df_importance = pd.DataFrame({'Feature': feature_names, 'Importance': importance})
df_importance = df_importance.sort_values(by='Importance', ascending=False)
df_importance


# Plotting
plt.figure(figsize=(8, 5))
plt.barh(df_importance['Feature'], df_importance['Importance'], color='teal')
plt.xlabel('Importance Score')
plt.ylabel('Feature')
plt.title('Feature Importance from Decision Tree')
plt.gca().invert_yaxis()
plt.show()Comments
Add Your Comment
Related Posts

🧠 AI with Python – 📊 Reliability Diagrams

🧠 AI with Python – 📈 Model Calibration Curves

🧠 AI with Python – 🔥 Feature Interaction Heatmaps

7-Day AI Crash Course
Learn how AI works, explore real-world examples, and build your first smart models step-by-step.
Perfect for beginners, students, and tech enthusiasts ready to start their AI journey.
No comments yet. Be the first to comment!