🧠 AI with Python – 🐍📈📊 Elbow Method to Find Optimal k
Posted on: September 18, 2025
Description:
Clustering is a powerful unsupervised learning technique, but one common challenge is deciding the number of clusters (k) to use.
The Elbow Method provides a simple, visual way to determine the optimal k for K-Means clustering.
Why Do We Need the Elbow Method?
- K-Means requires k in advance.
- Too few clusters → underfitting (broad, meaningless groups).
- Too many clusters → overfitting (clusters lose interpretability).
- The Elbow Method strikes a balance by analyzing how clustering performance improves with increasing k.
How It Works
The Elbow Method uses inertia (also called Within-Cluster Sum of Squares, WCSS):
- Inertia measures how tightly grouped the points are within each cluster.
- As k increases, inertia decreases because points are closer to their centroids.
- At some point, adding more clusters yields only marginal improvement → this is the elbow point.
Applying the Elbow Method
We try different values of k and calculate inertia for each.
inertia = []
for k in range(1, 11):
    kmeans = KMeans(n_clusters=k, n_init=10, random_state=42)
    kmeans.fit(X_scaled)
    inertia.append(kmeans.inertia_)
Then we plot inertia against k to visualize the curve.
plt.plot(range(1, 11), inertia, marker="o", linestyle="--")
plt.xlabel("Number of clusters (k)")
plt.ylabel("Inertia (WCSS)")
plt.title("Elbow Method for Optimal k")
plt.show()
Sample Output
The resulting plot looks like this:
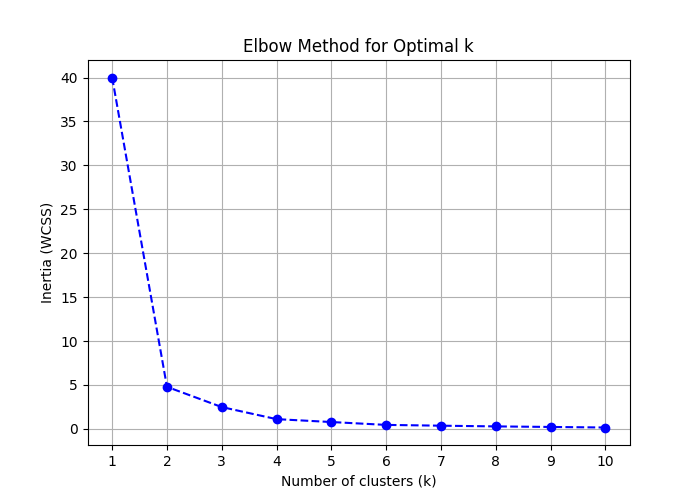
Figure: Elbow Method for Optimal k.
📊 At first, inertia drops steeply. 📊 After a certain k, the curve flattens. 📊 That bend — the elbow point — suggests the optimal number of clusters.
In the demo dataset, the elbow occurs around k = 2 or 3.
Key Takeaways
- The Elbow Method is a quick, intuitive way to estimate k.
- Works best when clusters are well separated.
- Should be combined with other methods (e.g., Silhouette Score) for confirmation.
- Helps avoid overfitting by not adding unnecessary clusters.
Code Snippet:
# Core libraries
import pandas as pd
import numpy as np
import matplotlib.pyplot as plt
from sklearn.preprocessing import StandardScaler
from sklearn.cluster import KMeans


# Demo dataset
data = {
    "CustomerID": range(1, 21),
    "AnnualIncome_k$": [15, 16, 17, 18, 20, 22, 25, 28, 30, 33, 60, 62, 65, 68, 70, 72, 75, 78, 80, 85],
    "SpendingScore":   [18, 20, 22, 25, 28, 30, 35, 40, 42, 45, 55, 58, 60, 62, 65, 66, 68, 70, 72, 75],
}
df = pd.DataFrame(data)

features = ["AnnualIncome_k$", "SpendingScore"]
X = df[features].values

# Standardize features
scaler = StandardScaler()
X_scaled = scaler.fit_transform(X)


inertia = []

# Try k from 1 to 10
for k in range(1, 11):
    kmeans = KMeans(n_clusters=k, n_init=10, random_state=42)
    kmeans.fit(X_scaled)
    inertia.append(kmeans.inertia_)


plt.figure(figsize=(7, 5))
plt.plot(range(1, 11), inertia, marker="o", linestyle="--", color="b")
plt.title("Elbow Method for Optimal k")
plt.xlabel("Number of clusters (k)")
plt.ylabel("Inertia (WCSS)")
plt.xticks(range(1, 11))
plt.grid(True)
plt.show()
Comments
Add Your Comment
Related Posts

🧠 AI with Python – 📊 Reliability Diagrams

🧠 AI with Python – 📈 Model Calibration Curves

🧠 AI with Python – 🔥 Feature Interaction Heatmaps

7-Day AI Crash Course
Learn how AI works, explore real-world examples, and build your first smart models step-by-step.
Perfect for beginners, students, and tech enthusiasts ready to start their AI journey.
No comments yet. Be the first to comment!